Understand every card and figure in the live sales and orders analytics dashboard.
Last updated: 2026-09-09
🔧 Reading the Sales and Orders Report
1
From the sidebar, open Performance then choose Performance (the first tab) — this opens the Analytics page directly.
2
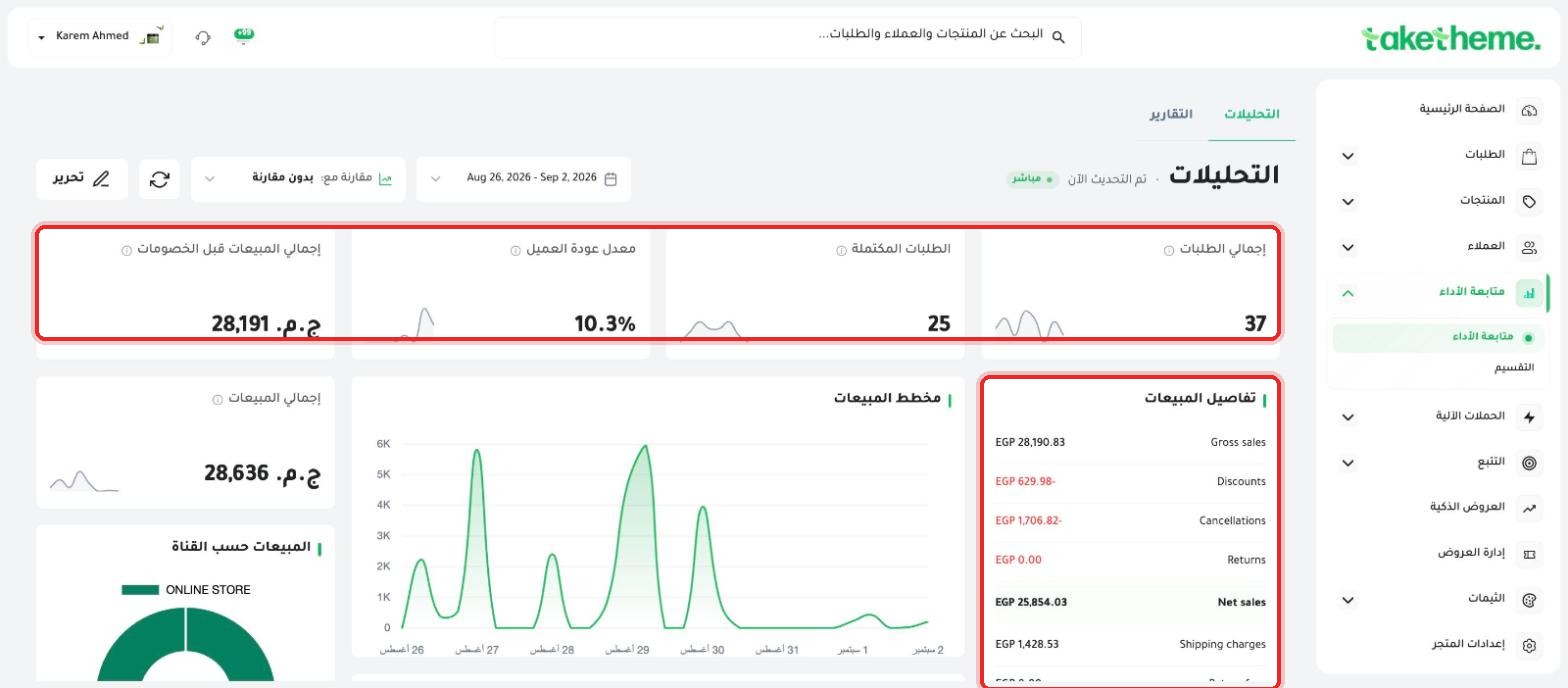
At the top of the page, a Live · Updated now badge shows that the numbers are live and not delayed, along with a date range picker (set to the last week in the example) and a Compare with option for a previous period.
📍 Main KPI cards: Total Sales, Total Orders, Completed Orders, Customer Return Rate, and the daily sales chart
3
The main KPI cards show: total sales before discounts, customer return rate, completed orders, total orders, and total net sales — each card comes with a mini chart (Sparkline) for the recent trend.
4
The Sales chart section shows a daily sales timeline; next to it, the Sales Breakdown section breaks the total figure down into its components: Gross sales, Discounts, Cancellations, Returns, Net sales, Shipping charges.
5
A bit further down, the Sales by Channel section shows the distribution of your sales in a donut chart — in the store we tested, everything was concentrated on the ONLINE STORE channel.
💡 The Edit button next to the page title lets you customize the layout and order of the displayed cards — see the article "Exporting and Sharing Reports" for details on adding or removing specific metrics.
❓ Frequently Asked Questions
What's the difference between (Total Sales Before Discounts) and (Net Sales)?
The first (Gross sales) is the total value of orders before deducting any coupons, cancellations, or returns, while the second figure accounts for all discounts and reflects actual net sales.
Does the report update in real time?
The "Live · Updated now" badge at the top of the page confirms that the data is live and automatically refreshed, not a delayed daily report.