
Reports & Analytics
Sales, product performance, and visitors in one place
Full articles
 Reading the Sales and Orders Report
Understand every card and figure in the live sales and orders analytics dashboard.
 Best-Selling Products Performance Report
Enable products-sold metrics from the large reports catalog.
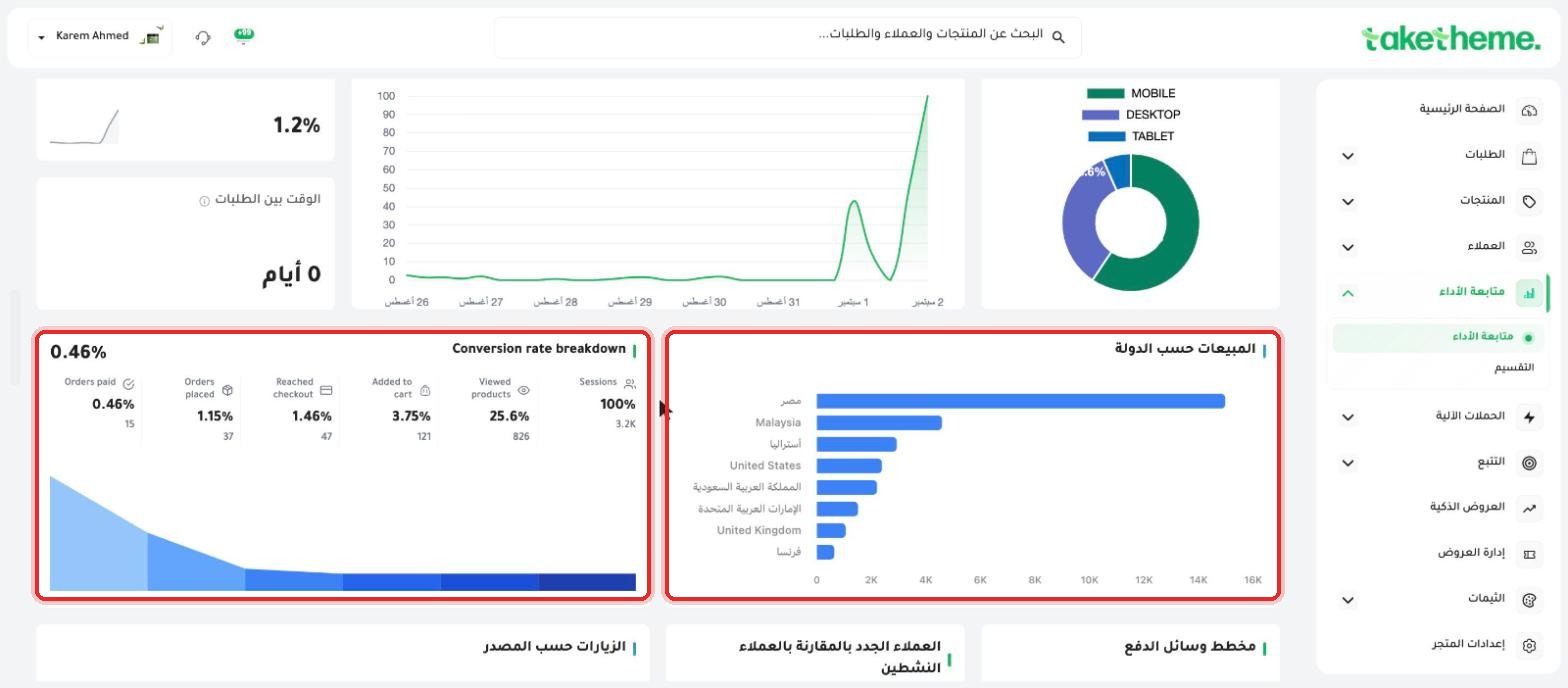 Visitors and Conversion Rate Report
Understand the conversion funnel from first visit to checkout, and your visitors' breakdown by device and country.
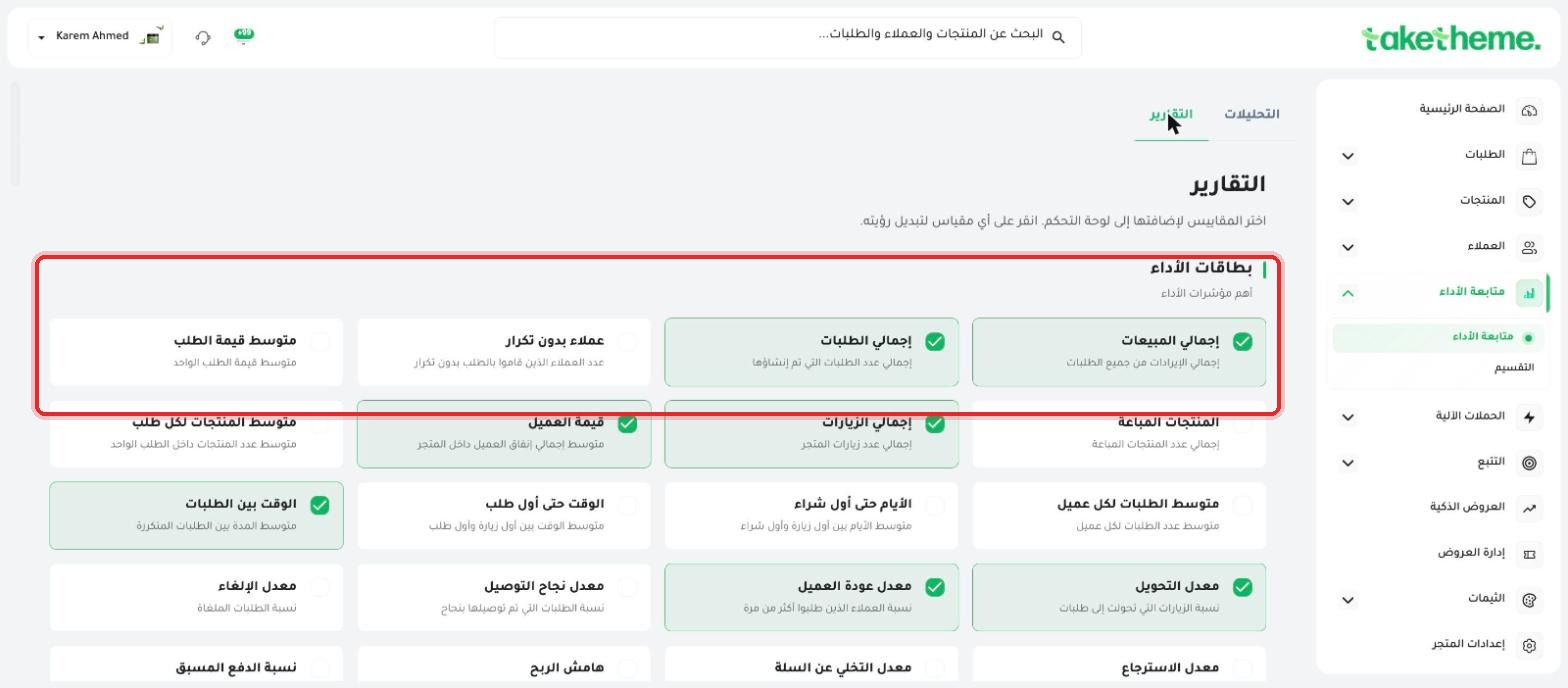 Exporting and Sharing Reports
Customize your analytics dashboard with your preferred metrics — and why there's no direct export button right now.
FAQ About ReportsQuick answers to the most common questions about reading reports and analytics.
What's the difference between the Home page and the Analytics page?
Home shows a quick summary of your top numbers plus a widget tracking your store setup completion, while Analytics is fully dedicated to digging into the numbers: conversion funnel, sales by country and device, and a large customizable metrics catalog.
Do the numbers change based on the date range I pick?
Yes, the date-range picker at the top of the Analytics page drives every card and chart shown, and there's a "Compare with" option against a previous period to measure growth or decline.
Why is my conversion rate low even though I get a lot of visits?
Check the conversion funnel in the "Visitors and conversion rate report" article to pinpoint exactly which step is losing most visitors before purchase.
Is there a difference between "total visits" and "Sessions" in the funnel?
The two terms mostly refer to the same concept (number of browsing sessions), but some parts of the interface use English terms alongside a fully Arabic UI — check the actual numeric values to confirm they match.
Couldn't find the answer?
My Support TicketsView and track your support ticketsCreate New TicketGet help from our support teamEmailsupport@taketheme.com — we reply within 12 hours
ابدأ اليوم
Plans from EGP 599/month — 0% commission
3-day trial · no credit card