Understand the conversion funnel from first visit to checkout, and your visitors' breakdown by device and country.
Last updated: 2026-09-09
🔧 Analyzing Visitors and Conversion Rate
1
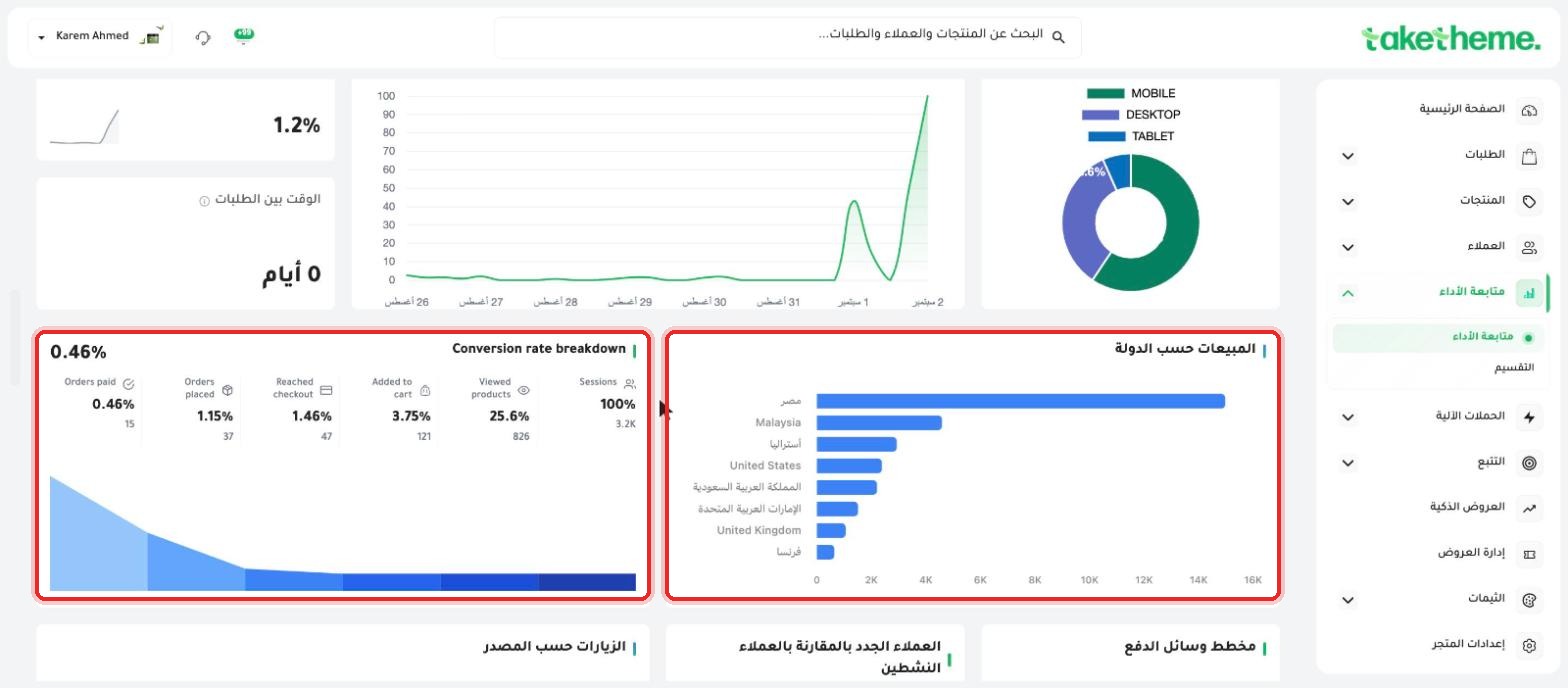
From the main Analytics page, scroll down below the sales chart section to find the Conversion rate breakdown section — a complete, step-by-step conversion funnel.
📍 Conversion funnel (Sessions → Viewed products → Added to cart → Reached checkout → Orders placed → Orders paid) and a sales chart by country and device
2
The funnel shows, in numbers and percentages, every step: Sessions (100% of visits as the starting point), Viewed products, Added to cart, Reached checkout, Orders placed, and finally Orders paid with its percentage of total visits.
3
Next to the funnel, the Sales by Country section uses a bar chart to rank countries by sales value — in the store we tested, Egypt was clearly in the lead over the other countries.
4
A bit higher up, a donut chart splits visits by Device (MOBILE, DESKTOP, TABLET) — very useful for knowing whether your store's mobile design works well, especially if most of your visitors are on mobile.
5
At the bottom of the page there are additional sections (revealed by scrolling down): Visits by Source, New Customers vs. Active Customers, and a Payment Methods chart.
💡 The "Time Between Orders" section next to the funnel shows the average number of days between a customer's order and their next one — a good indicator for assessing customer loyalty and repeat purchases.
❓ Frequently Asked Questions
What's the most important step in the funnel to watch if my conversion rate is weak?
Watch for the biggest drop-off between two consecutive steps in the funnel — if most visitors reach "Reached checkout" but very few complete to "Orders paid", the problem is most likely in the checkout steps themselves or the shipping options.
Does the device chart (Mobile/Desktop/Tablet) measure visits or sales?
Based on its placement next to the conversion funnel and its description, it most likely measures the distribution of visits themselves by device type, not the sales value from each device.
AnalyticsVisitorsConversion RateReports and Analytics